ID23 RealTime XAFS (RTXAFS)
1. Introduction
The Real-time X-ray Absorption Fine Structure (RXAFS) beamline is a state-of-the-art tool specifically designed for X-ray absorption and emission spectroscopy. It will be situated at the ID23 section of the Korea-4GSR and will utilize an in-vacuum undulator as its light source. This advanced beamline will produce highly focused and intense X-ray beams across a wide energy range, derived from electron beams with a low emittance of about 60 pm·rad. Through offering X-ray Absorption Spectroscopy (XAS), electronic and local structures can be unveiled by exciting core electrons to unoccupied orbitals with an external X-ray that matches the corresponding edges’ energy.
The primary experimental technique of the RXAFS beamline is Quick X-ray Absorption Spectroscopy (QXAS), which enables XAS measurements on a millisecond time scale. QXAS can be utilized to study various chemical reaction mechanisms, including the redox processes of battery materials during charging and discharging, intermediates in catalytic reactions, and phase transition processes in novel materials. Additionally, the RXAFS beamline will support X-ray Emission Spectroscopy (XES), providing in-depth insights into the electronic structure of occupied states in novel and advanced materials using a variety of analyzer crystals and a position-sensitive detector.
By delivering both QXAFS and XES, the RXAFS beamline is poised to play a pivotal role in various advanced material sciences, such as batteries, catalysts, and biomedicines, and is expected to open up new frontiers in research.

Figure 1. Expected scientific applications of RXAFS beamline.
2. Scientific objectives
2.1 X-ray Absorption Spectroscopy (XAS)
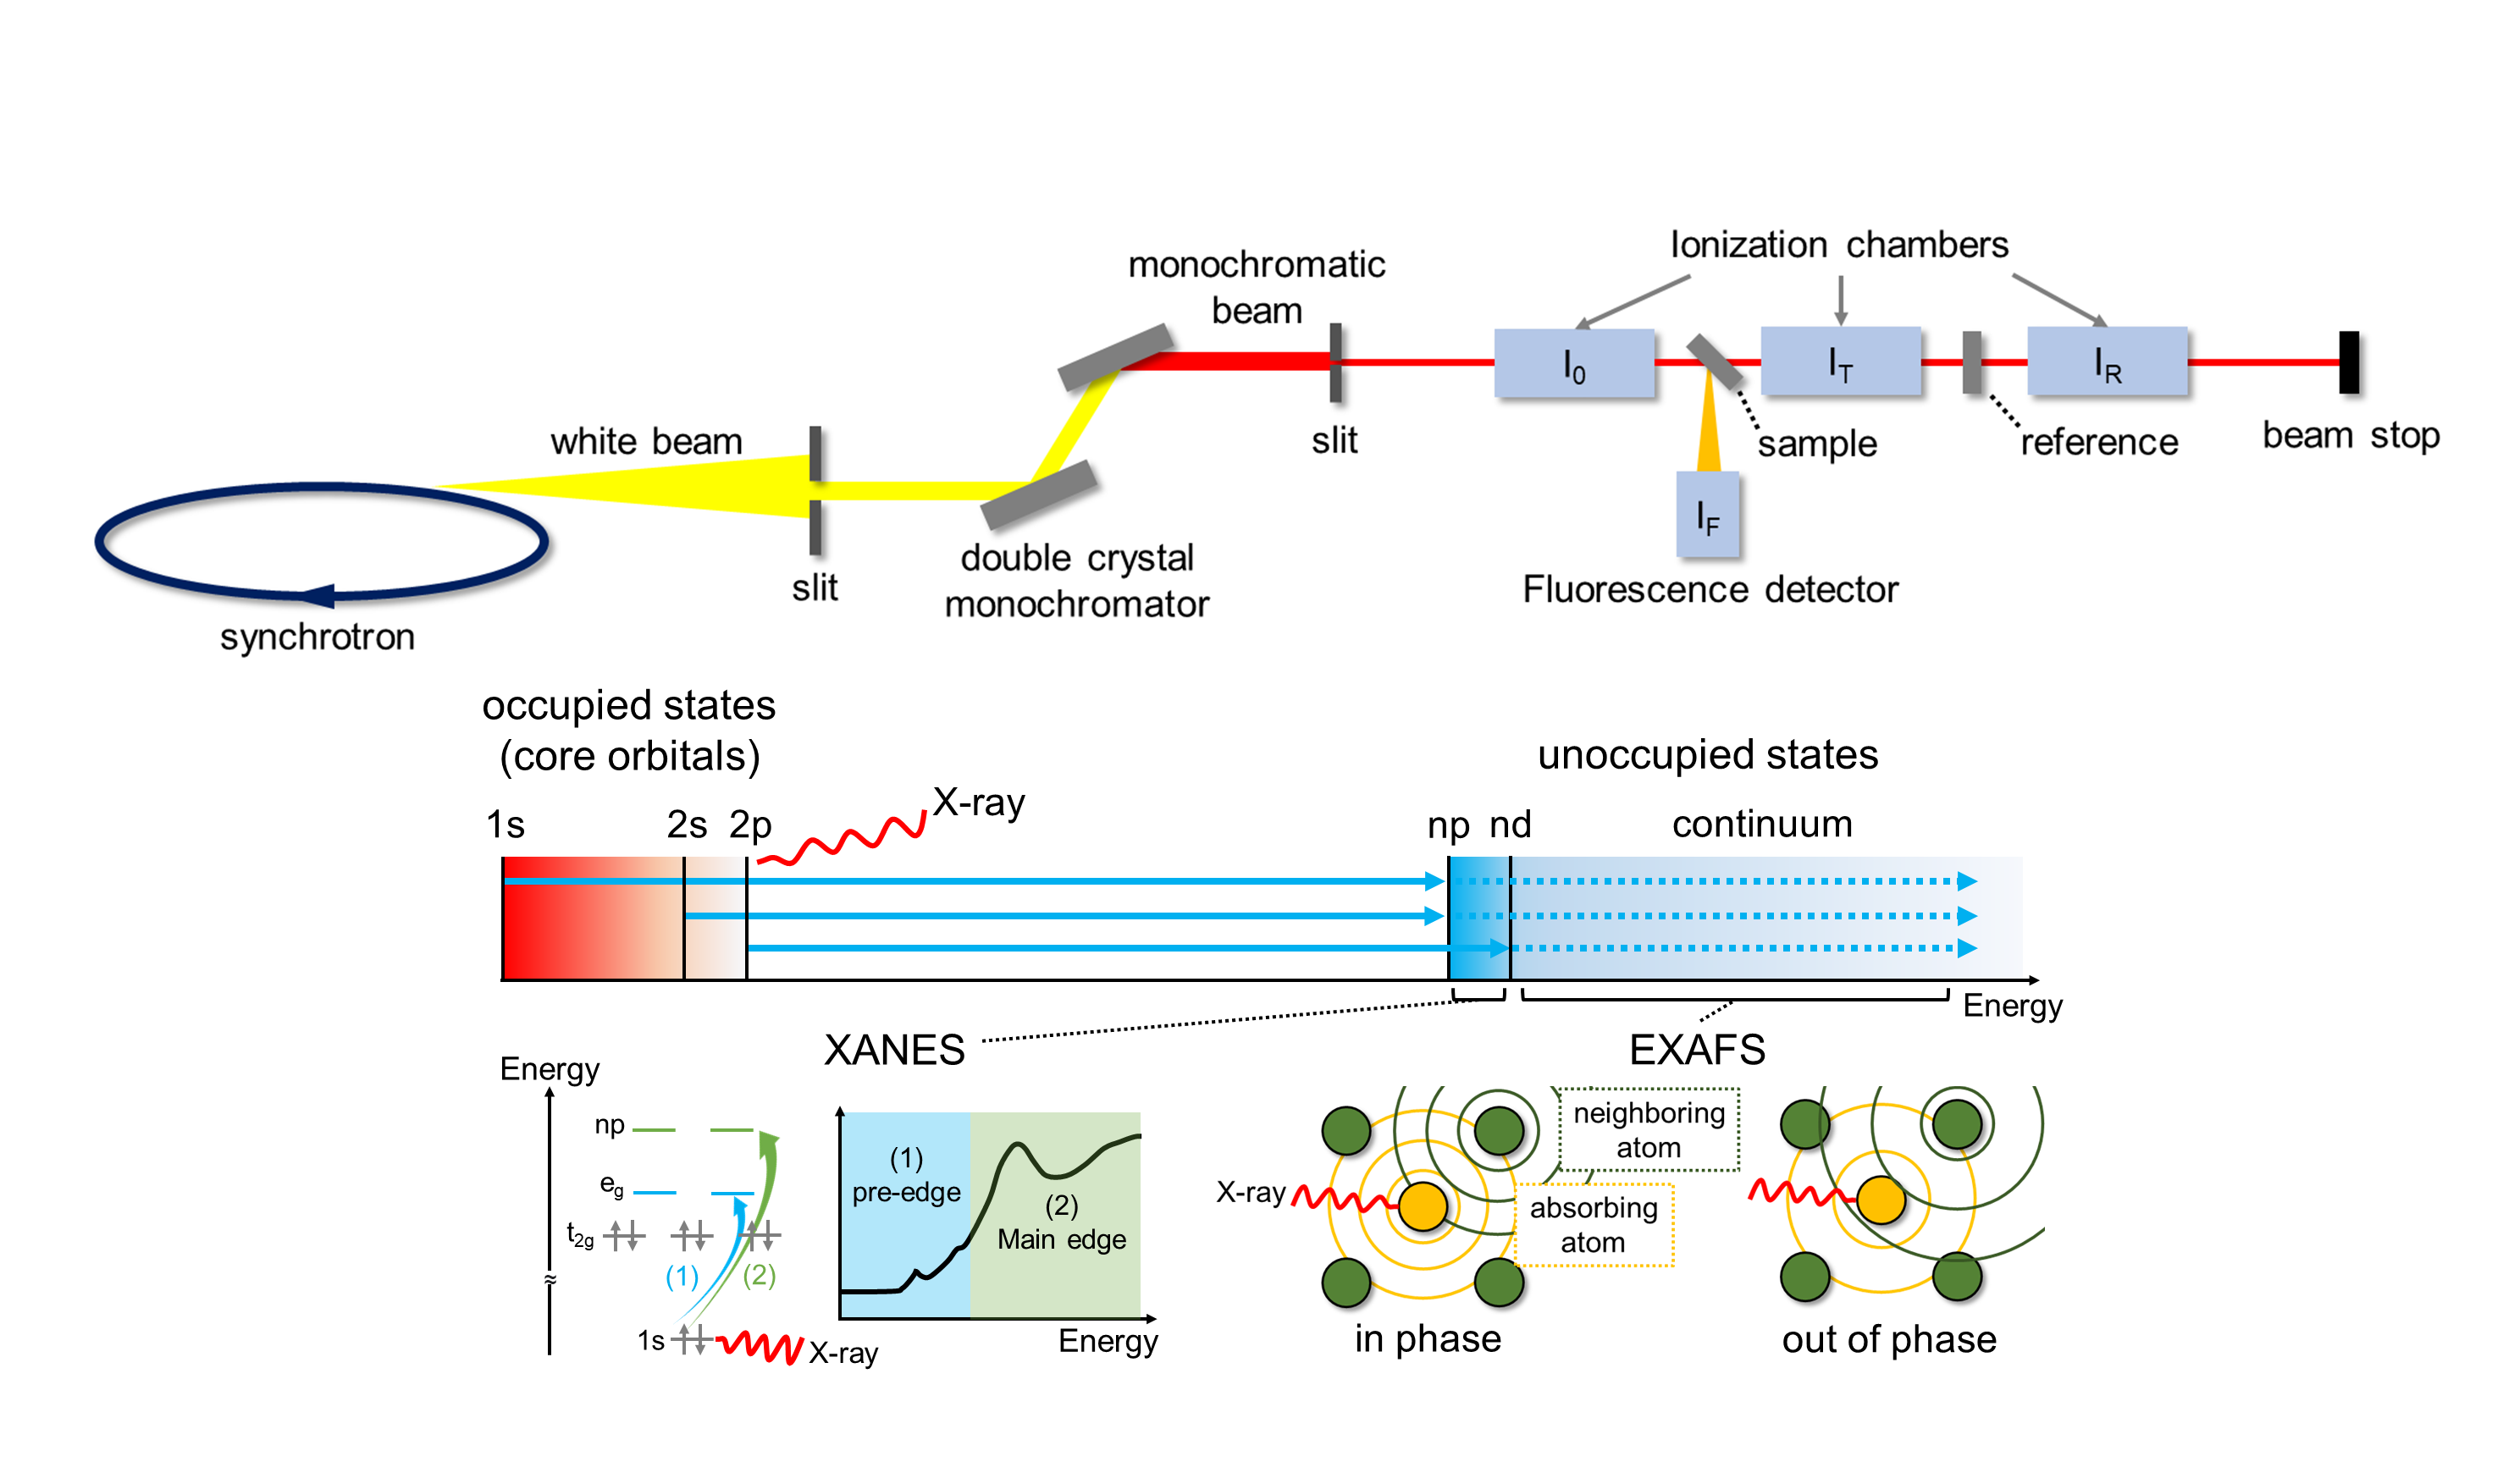
Figure 2. Schematic illustration of XAS
XAS, an experimental method for gathering data on X-ray intensity before and after it passes through a material sample, is a versatile tool that inspires with its potential. This data is then used to apply the Beer-Lambert law, enabling the determination and analysis of the sample’s X-ray attenuation coefficient. The energy of the absorption edge, which varies depending on the element type, allows for the selective analysis of elements using XAS. This versatility means that even if a sample contains a variety of elements, it is possible to obtain individual local structure information for a specific element. Furthermore, XAS is a versatile analysis technique that is not limited by the presence or absence of crystallinity or the shape of a sample, as it can observe the local structure around a specific element within a few angstroms. This versatility is crucial in the development of various advanced materials, including secondary batteries, catalysts, semiconductor materials, and solar cells. In the RXAFS beamline, XAS is a fundamental technique that supports its normal operation with a user-friendly measurement method.
2.1 Quick X-ray Absorption Spectroscopy (QXAS)
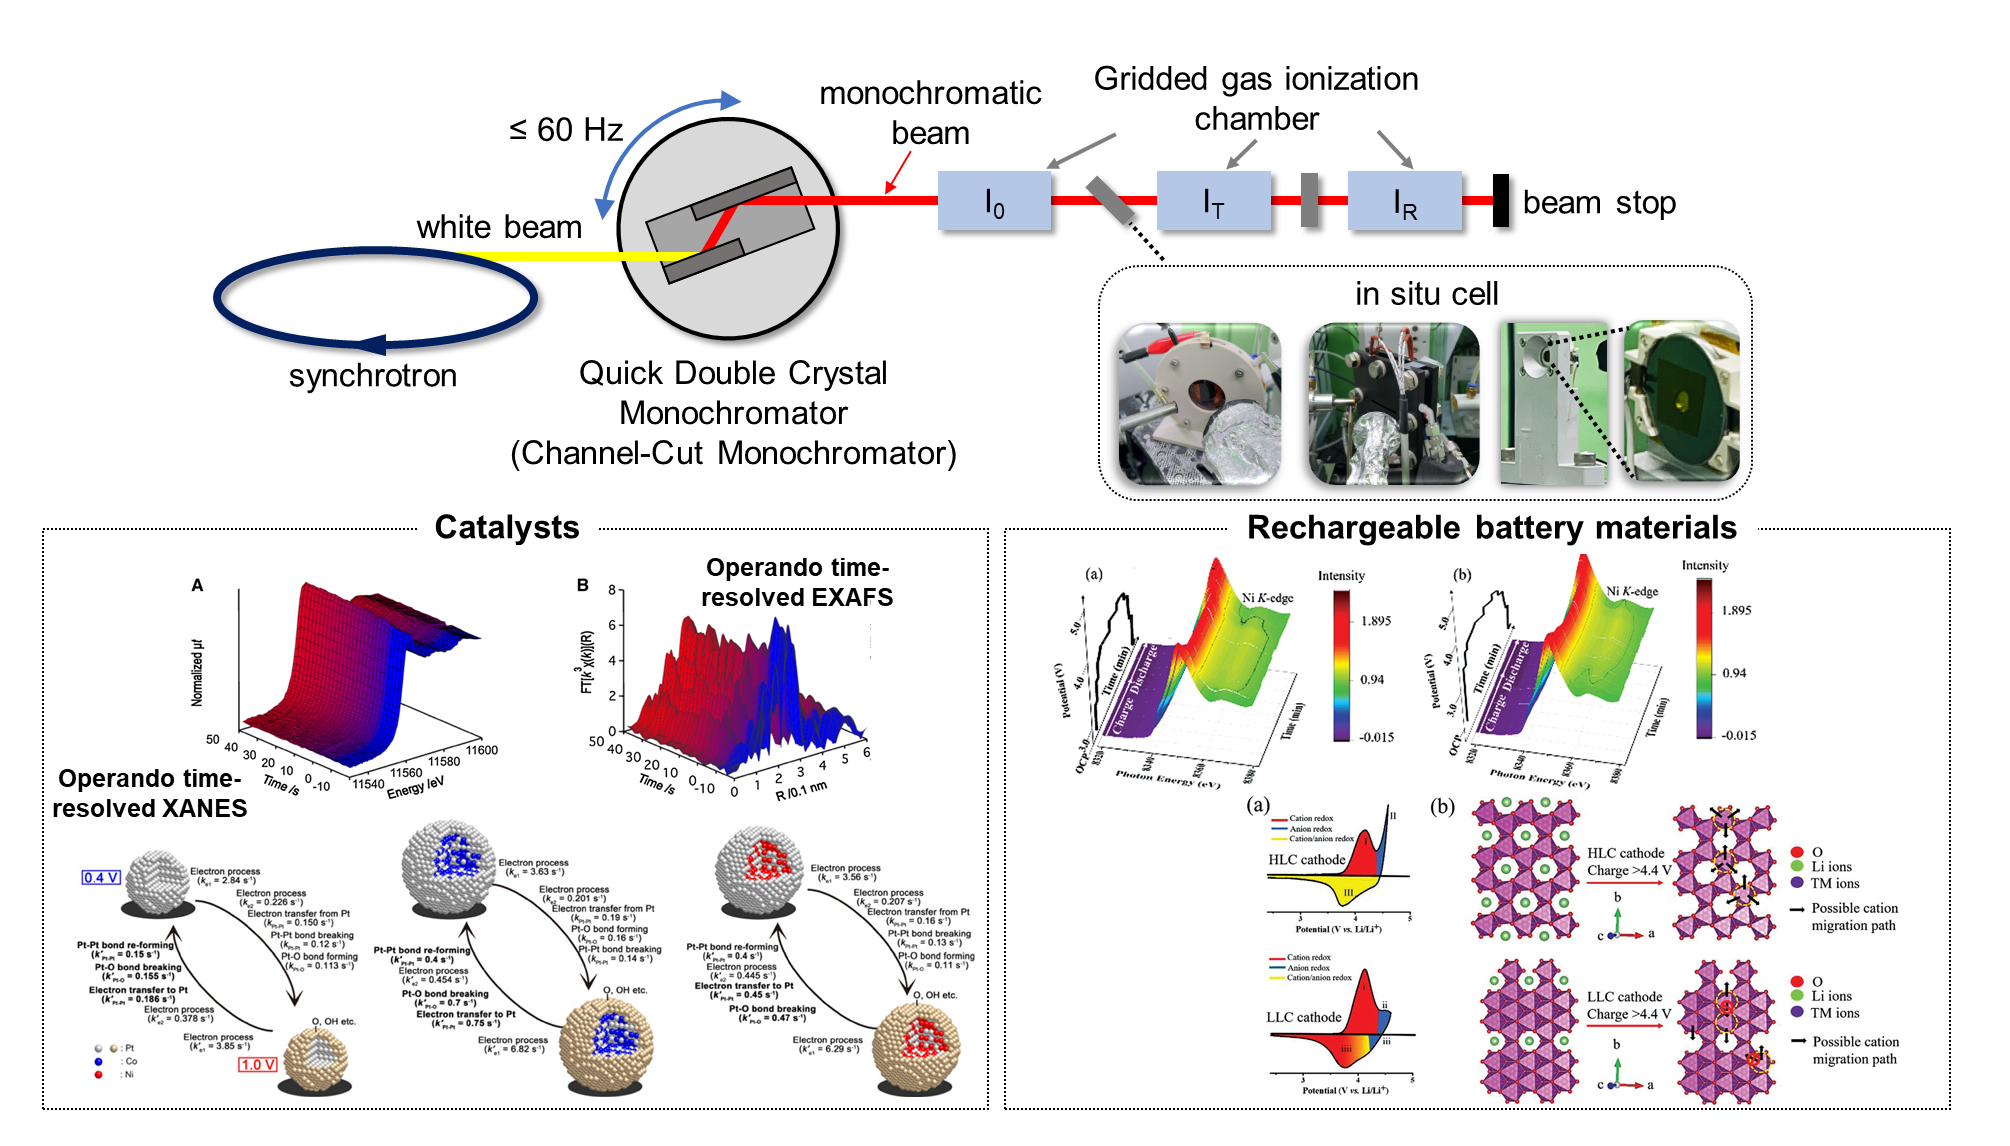
Figure 3. Schematic illustration of Quick XAS
XAS, which utilizes hard X-rays and can be measured at room temperature and normal pressure, is advantageous for in situ/operando analyses. By employing specific conditions such as temperature, voltage, and pressure, the in situ XAS technique allows for tracking and observing changes in the electronic and bonding states of a material under various reaction conditions. A typical XAS analysis takes several to 10 minutes per spectrum, capturing the average structural change occurring during the measurement time. However, the time gap between each XAS spectrum poses a challenge when studying reaction mechanisms using this technique. QXAS, on the other hand, is a high-speed measurement technique that overcomes this challenge. It provides a short measurement time of several milliseconds to several seconds, enabling real-time XAS measurements and research into reaction mechanisms without information gaps.
The focus of QXAS research has primarily been on electrocatalysts. It is essential to comprehend the reaction mechanisms through QXAS, as the initial structural changes in the catalyst can significantly impact the reaction pathway and the resulting products. Recently, QXAS has demonstrated its capability to unveil the fast-charging process of cathode materials for lithium-ion batteries by identifying the oxidation process of each element over time with a sub-second time scale. Therefore, QXAS is expected to play a vital role in materials development with improved performance by allowing the observation of structural changes during various chemical reactions. A key part of this advancement is the RXAFS beamline, which aims to offer the QXAS method with a measurement time scale on the order of ten milliseconds by placing a Quick Double Crystal Monochromator (QDCM) and appropriate mirror systems in the beamline layout, thereby ensuring the continued progress and application of QXAS in the field.
2.3 X-ray Emission Spectroscopy (XES)

Figure 4. Schematic illustration of XES
XES with high energy resolution is increasingly pivotal for gaining insights into electronic and coordination structures by detecting X-ray fluorescence from core-to-core (CtC) and valence-to-core (VtC) transitions during the relaxation process. The use of optimal analyzer crystals, which are crucial for dispersing the X-ray photons into their respective energies, is imperative to achieve high energy resolution in XES measurements. CtC XES captures fluorescence signals stemming from relaxation processes from np orbitals to core 1s orbitals, providing valuable information about oxidation states. On the other hand, VtC XES is sensitive to valence band structure, making it possible to discern ligand coordination and the atoms binding with metal sites. Additionally, XES can be specialized by integrating time-resolved techniques to track reaction dynamics and structural phase transitions.
XES, known as a ‘photon-in-photon-out’ method, requires a high-flux beam to collect fluorescence signals within a measurement time. The primary objective of the RXAFS beamline is to support in-situ or real-time measurements. The powerful beam from the multi-bend achromat-based storage ring will prove beneficial in reducing measurement time to a few minutes or even seconds. This exciting development anticipates XES at the RXAFS beamline to serve as a foundational platform for studying in-depth electronic and structural changes, especially when combined with XAS. This combination provides insight into overall electronic structures, including valence and conduction bands, during in-situ measurements.
3. Beamline Requirements for the Insertion Device
The demand for high-quality, high-resolution XAS data is increasing in the field of advanced and next-generation materials. This XAS data, obtained from highly intense X-ray beams per unit area, is crucial for gathering detailed and accurate information about these samples. XAS beamlines that provide focused and intense X-ray beams generated by an undulator light source are essential to meet this demand. Table 1 provides detailed specifications for the undulator, which has a 24 mm period and a total length of 3 m.
Table 1. Undulator Parameters
Undu lator |
Per iod ( mm) |
Len gth |
:s ub :` g` (m m) |
K : sub :m ax |
Po wer ( kW) |
Power density (kW mrad:s up:-2) |
Max. power after FE (kW) |
|---|---|---|---|---|---|---|---|
IVU24 |
24 |
3 |
5- 16 |
2. 747 |
1 7.9 |
165 |
0.87 Through 2(h)×2(v) mm2 FE mask |
The X-ray beam bandwidth produced by the planar undulator is approximately 1% of the beam energy. XAS consists of two regions: the X-ray Absorption Near Edge Structure (XANES) near the edge energy and the Extended X-ray Absorption Fine Structure (EXAFS). To measure XAS up to the EXAFS region, it is essential to widen the energy bandwidth of the beam by about 1.5 keV from the planar undulator. The concept of undulator tapering will be applied at the RXAFS beamline to broaden the energy bandwidth through positive tapering, where the undulator gap increases along the undulator length.
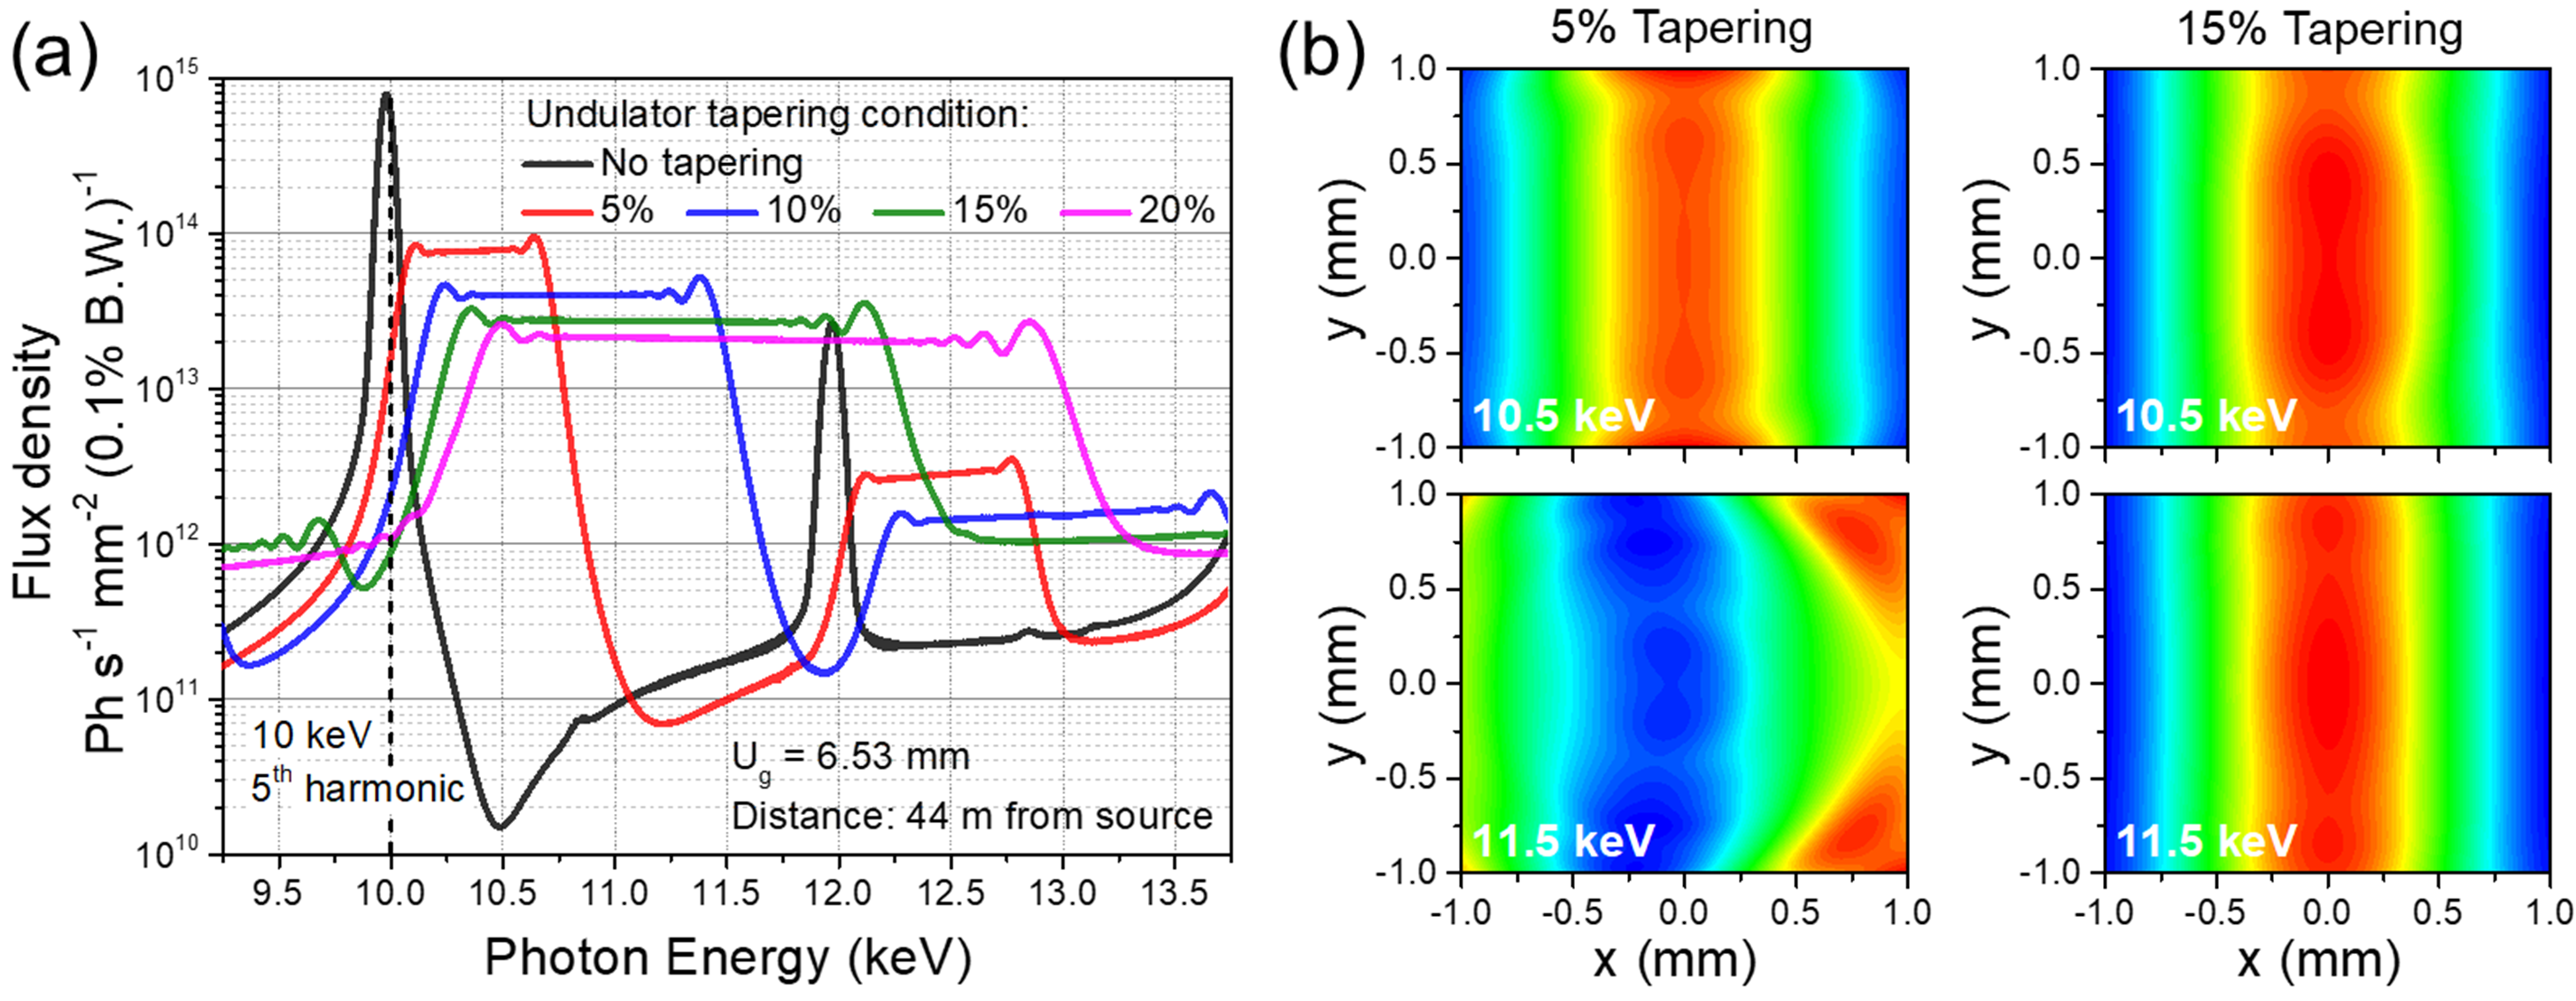
Figure 5. The change of photon beam flux and beam shape upon different tapering conditions. (a) Flux density and bandwidth change upon tapering condition at an initial gap of 6.53 mm. (b) comparison of beam shape variation between different tapering conditions.
Figure 5a shows the flux and bandwidth changes that enter the white beam slit with a 1 (h) × 1 (v) mm² slit opening under several undulator tapering conditions. It should be noted that the bandwidth can be sufficiently broadened by optimizing the tapering conditions. The undulator tapering conditions, a crucial factor, also significantly affect the beam shape, as shown in Figure 5b. In 5% tapering condition with a 6.53 mm initial gap, the beam shapes at 10.5 keV and 11.5 keV are quite different. However, it can be seen that the unchanged beam shape at both energies at 15% tapering condition. It can be concluded that tapering the undulator gap more is necessary to gain the unchanged beam shape along the beam energy change to measure the XAS, including the EXAFS region.
4. Beamline Requirements for the Front End
The RXAFS beamline will employ the latest High Heat-Load Front End, capable of handling up to 18 kW of power. It will feature a windowless exit design with a 2 (h) × 2 (v) mm2 exit mask aperture, which is essential for maintaining optimal performance. Further details are provided in the ‘Front End’ section of this report.
5. Beamline Layout
Table 2 includes the design goals of the beamline. The beamline layout is designed to meet these goals and satisfy users’ demands regarding QXAS and XES.
Table 2. Beamline design goals
Light Source |
In-vacuum Undulator (IVU24, 3m) |
|
|---|---|---|
Energy Range |
4 - 40 keV |
|
Measurement time for one EXAFS data |
Quick XAFS |
~ 50 ms |
Normal XAFS |
~ 3 min (on-the-fly scan) ~ 20 min (step scan) |
|
Energy resolution (ΔE/E) |
~ 1.4 × 10⁻⁴ Si (111) / ~ 3 × 10⁻⁵ Si (311) |
|
Beam size at sample position (@ 10 keV) |
18 (H) × 8 (V) μm2 (focused beam, @ 75 m) 1020 (H) × 810 (V) μm2 (unfocused beam, @ 60 m) |
|
Beam flux at sample position (ph/s) |
Tuned Undulator |
~ 9 × 10¹³ (@ 5 keV) ~ 4 × 10¹² (@ 40 keV) |
Tapered Undulator |
~ 2 × 10¹² (@ 7 keV) ~ 3 × 10¹¹ (@ 25 keV) |
|
Main equipment |
Load Mirror (HHLM) Co ntinuous-scan Double Crystal Monochromator (C-DCM)
Double Crystal Monochromator (Quick DCM)
Dispersive Fluorescence Detector Fast-response Gas Ionization Chambers
Sensitive Detector (2D PSD) |
|
Experimental equipment |
Hi gh-throughput sample holder & Sample auto-changing system
spectrometer |
|
In situ experiments |
℃)
thermocatalysis (heating & gas environment)
|
The beamline layout of RXAFS is illustrated in Figure 6. The first optics after the Front-End is the High Heat Load Mirror (HHLM), reflecting the beam from the Front-End in the horizontal direction and serving two crucial functions. Firstly, the HHLM reduces the thermal load impacting DCM’s 1st crystal by absorbing the high-energy X-ray beams. Secondly, it collimates the X-ray beam by the sagittal radius of the mirror surface. This collimation improves the energy resolution of the monochromatic beam after passing the Double Crystal Monochromator (DCM). Furthermore, it minimizes the beam flux loss due to the limitation of Darwin’s width of the Si crystal of DCM.
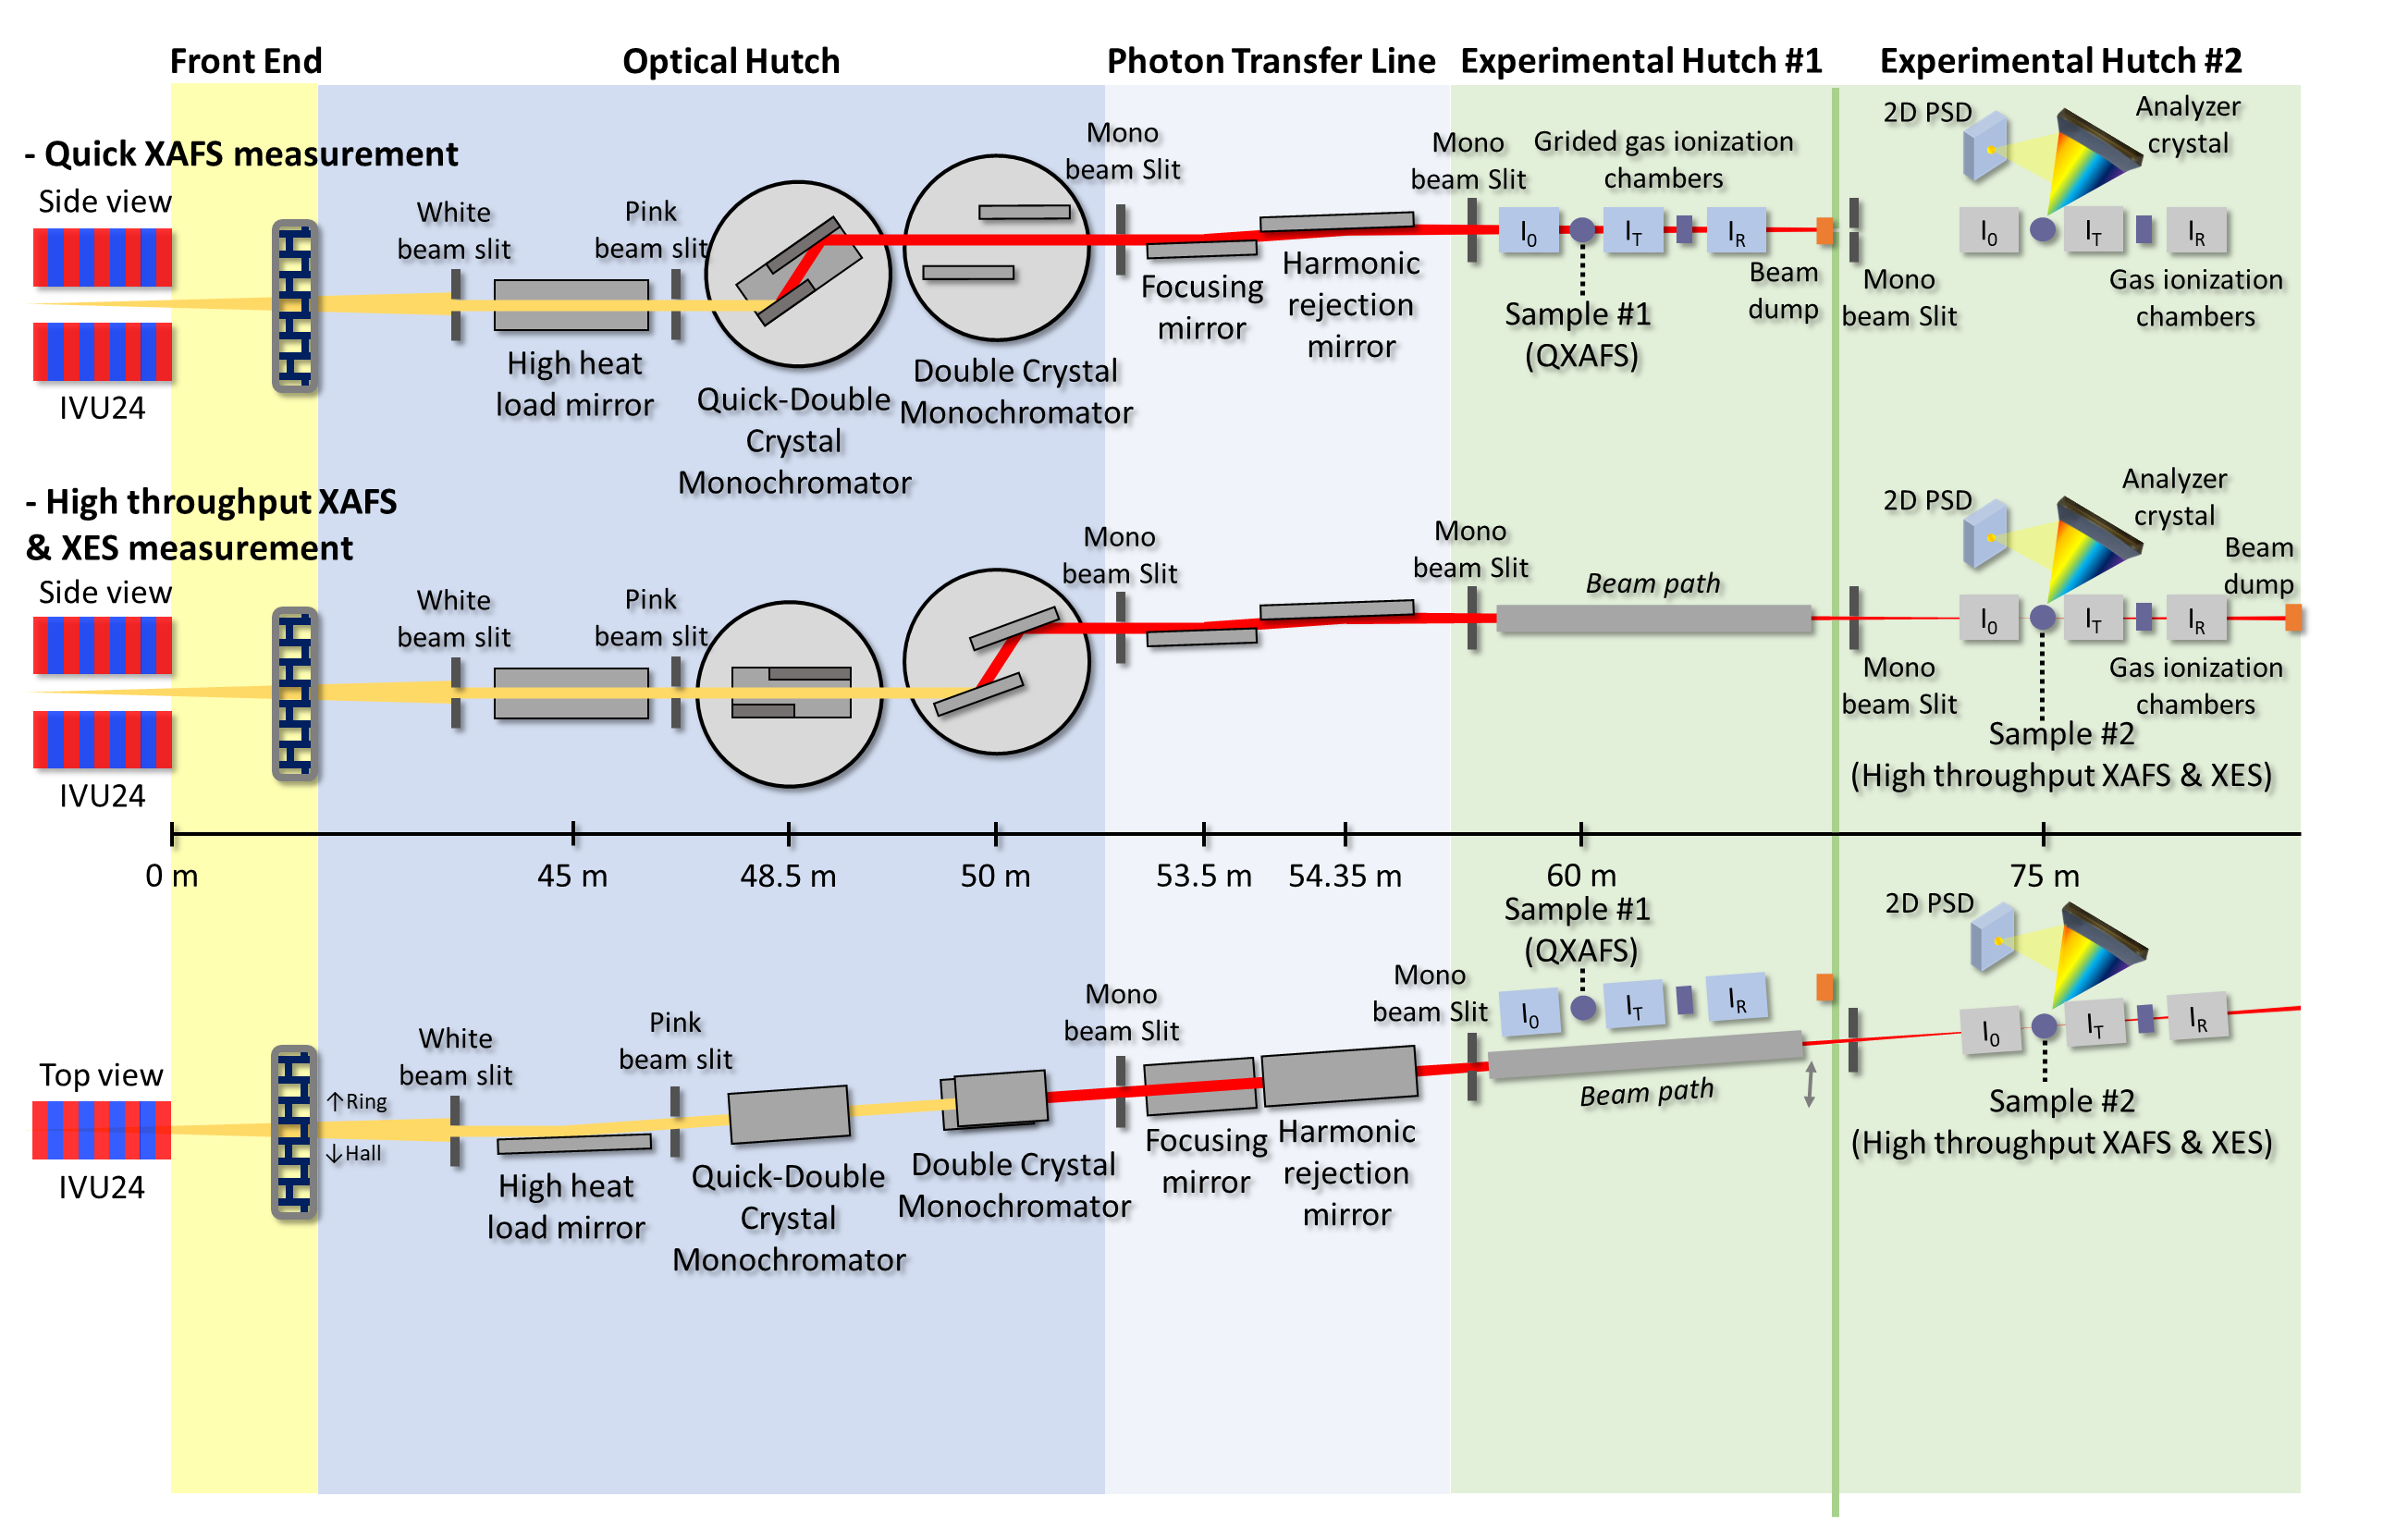
Figure 6. Schematic illustration for beamline layout.
The QDCM, located 48.5 m from the source and 3.5 m after HHLM, plays a key role in the beamline. It enables rapid changes in beam energy with a 10-50 Hz speed, facilitating using the QXAS method. Positioned 50 m from the source after the QDCM, the standard DCM provides a more stable monochromatic beam than the QDCM. This stability is essential for standard XAS and XES measurements, where maintaining a constant beam position during the measurement is critical for obtaining high-quality data. By having both DCMs available in the beamline layout, users have the flexibility to choose the appropriate monochromator based on the experimental method.
The horizontal focusing mirror (HFM) system will be positioned 53.5 m from the source. It will consist of two sagittal cylinder mirrors with different radius of curvature and reflect the beam in a vertical direction (upside). The two mirrors have different mirror surface materials: one has a bare Si mirror surface without any coating, while the other has a 5 nm Rh / 50 nm Pt bilayer as coating material. The selection of a mirror depends on the energy range being used. Mirrors can be swapped with each other to deliver high-energy X-ray beams or to efficiently suppress the higher-harmonic beam, which cannot be removed by DCMs.
The harmonic rejection mirror (HRM) system will be positioned 54.35 m from the source, directly behind the horizontal focusing mirror system. It will reflect the beam downward in the vertical direction at the same reflection angle as the focusing mirror to maintain the vertical beam position. The HRM has a flat mirror surface that a bender in the system can bend to focus the beam vertically. It consists of three stripes: Si, Rh 5nm/Pt 50 nm, and Pt 50 nm layers. Similar to the HFM, these layers can be interchanged based on the X-ray energy to be used. The HRM is important for parallelizing the beam reflected from the HFM to minimize the change in vertical beam position caused by varying HFM incidence angles.
There will be two designated sample positions labeled #1 and #2, located 60 m and 75 m from the source, respectively. A beam path should be installed at sample position #1 to deliver the beam for experiments conducted at sample position #2. Sample position #1 will be specifically assigned for conducting QXAS experiments, so equipped with three fast-responsive ionization chambers and a PIPS fluorescence detector. Sample position #2, on the other hand, will be used for conducting standard XAS (or High-Throughput XAS) and XES experiments.
5.1 Beamline Component Table
Table 3 includes the main components of the RXAFS beamline and their location from the source.
Table 3. Main components
Com ponent |
Distance from source* |
S pecification |
Usage |
|---|---|---|---|
PBPM-3 |
41 m |
Pick-up type |
Diagnosing white beam position |
Movable Mask |
42 m |
Water Cooled |
Aligning the white beam |
At tenuator |
43.7 m |
Water Cooled, CVD Diamond, B 4C, Si |
Removing low-energy X-ray beam |
White Beam Slit |
44 m |
Water Cooled, Max. opening size: 1.2(h)×1.2(v) mm2 |
1) Eliminating the heat load by the white beam 2) Preventing the accidents due to malfunction of the movable mask 3) Diagnosing beam position through electron current readout function |
HHLM (High Heat Load Mirror) |
45 m |
In-Ga eutectic cooled 1× sagittal cylinder mirror (Rh 5 nm/Pt 50 nm) |
1) Eliminating of heat load by high-energy X-ray beams 2) Collimating the X-ray beams |
Pink Beam Slit |
47 m |
Water Cooled |
2) Removing the scattered beams 3) Diagnosing beam position through electron current readout function |
Pink Beam Screen |
47.4 m |
Water Cooled, YAG+CCD |
2) Diagnosing pink beam shape |
QDCM |
48.5 m |
Si(111)&(311) LN2 Cooled |
1) Monochromatization of the X-ray beam 2) Fast energy scanning speed of 10 ~ 50 Hz |
DCM |
50 m |
Si(111)&(311) LN2 Cooled |
Monochromatization of the X-ray beam |
Pink Beam Stop |
50.8 m |
Water Cooled, YAG+CCD |
|
Mono Beam Slit |
52.4 m |
4 way-slit |
2) Removing the scattered beams |
Diamond screen monitor |
52.6 m |
CVD diamond. Thickness: 50 μm |
2) DCM 2nd crystal feedback |
HFM (Ho rizontal Focusing mirror) |
53.5 m |
2×sagittal cylinder mirror (Si, Rh 5 nm/Pt 50 nm) |
1) Focusing the beam in the horizontal direction 2) Removing high-harmonic X-ray beams |
HRM ( Harmonic R ejection Mirror) |
54.35 m |
Flat mirror 3×Strip (Si, Rh 5 nm/Pt 50 nm, Pt 50 nm) |
1) Focusing the beam in the vertical direction 2) Removing high-harmonic X-ray beams 3) Parallelizing the beam path |
Mono Beam Slit |
55.5 m |
4 way-slit |
2) Removing the scattered beams |
Mono Beam Screen |
55.8 m |
YAG+CCD |
2) Diagnosing mono beam shape
|
Diamond screen monitor |
58 m |
CVD diamond Thickness: 50 μm |
1) Diagnosing mono beam position 2) HRM feedback (long-term) |
Hutch Shutter |
58.6 m |
Blocking the mono beam |
|
Hutch Slit |
59.2 m |
4 way-slit |
Defining the mono beam |
Sample Position #1 (QXAS) |
60 m |
Grided Gas Ionization Chamber, PIPS, In Situ Cell |
QXAS experiment stage |
Mono Beam Screen |
66 m |
YAG+CCD |
2) Diagnosing mono beam shape |
Hutch Slit |
72 m |
4 way-slit |
Defining the mono beam |
Nanobeam position monitor |
74.5 m |
Kapton, Thickness: 75 μm Positional resolution: < 100 nm |
Diagnosing mono beam shape and position |
Sample Position #2 ( XAS+XES) |
75 m |
Gas Ionization Chamber Analyzer Crystals (JJ-X ray), Energy Dispersive Fluorescence Detector, 2D PSD |
XES & High-throughput XAS experiment stage |
6. Optics Overview
6.1 Optics Specifications
The detailed specifications for the optics are listed in Table 4.
Table 4. Optics specifications
HHLM |
QDCM* |
DCM |
HFM |
HRM* |
|
|---|---|---|---|---|---|
Distance from source (m) |
45 |
48.5 |
50 |
53.5 |
54.35 |
Incident Angle |
2 mrad |
4. 5–30: sup:o (Si 111) 5. 0–15: sup:o (Si 311) |
4. 5–30: sup:o (Si 111) 5. 0–15: sup:o (Si 311) |
2-3 mrad |
2-3 mrad |
Shape |
Sagittal cylinder |
Flat |
Flat |
C ylindrical |
Flat |
Tangential Radius (km)* |
7 – 40 km (bender) |
∞ |
12 – 25 km (b ender) |
||
Sagittal Radius (mm) |
180 |
61.4 (2 mrad): [Rh 5 nm/Pt 50 nm] 92.0 (3 mrad): [Si] |
∞ |
||
Surface Normal direction |
H orizontal |
V ertical |
|||
** Substrate** |
Si |
Si(111) / Si(311) |
Si(111) / Si(311) |
Si |
Si |
Coating Materials ** (Thickness, nm)** |
[Rh 5 nm/Pt 50 nm] |
[Si] [Rh 5 nm/Pt 50 nm] |
[Si] [Rh 5 nm/Pt 50 nm], [Pt 50 nm] |
||
Beam size (H×V) @ 10 keV (μm×μm) |
1200×1160 |
12 90×1190 |
13 30×1190 |
1410×1170 |
136 0×1120 |
Footprint (L × H) (mm×mm) |
600×1.2 |
18×1.2 |
18×1.2 |
600×1.2 |
6 00×1.2 |
Substrate size (L×W×H) ( mm×mm×mm) |
800×50×55 |
5 5×40×50 (1:s up:st c rystal) |
6 0×25×50 (1:s up:st c rystal) |
600×60×50 |
800 ×50×50 |
Focus distance (m) |
∞ |
21.5 m |
∞ |
||
Roughness, σ* (r.m.s.)* |
< 0.3 nm |
< 1 μm |
< 1 μm |
< 0.3 nm |
< 0.3 nm |
Slope error ** (Tangential / sagittal)** (μrad, r.m.s.) |
<1.5/<5.0 |
<1 |
<1 |
<1.5/<5.0 |
<0.2 5/<1.0 |
Max total heat load (W) |
16.3 |
56.1 |
52.8 |
||
Max surface heat load (W mm-2) |
0.0326 (@4 keV) |
28.1 (@4 keV) |
26.4 (@4 keV) |
6.2 High Heat Load Mirror (HHLM)
The HHLM, located at 45 m from the source, will serve the following purposes:
Beam collimation
High heat load management
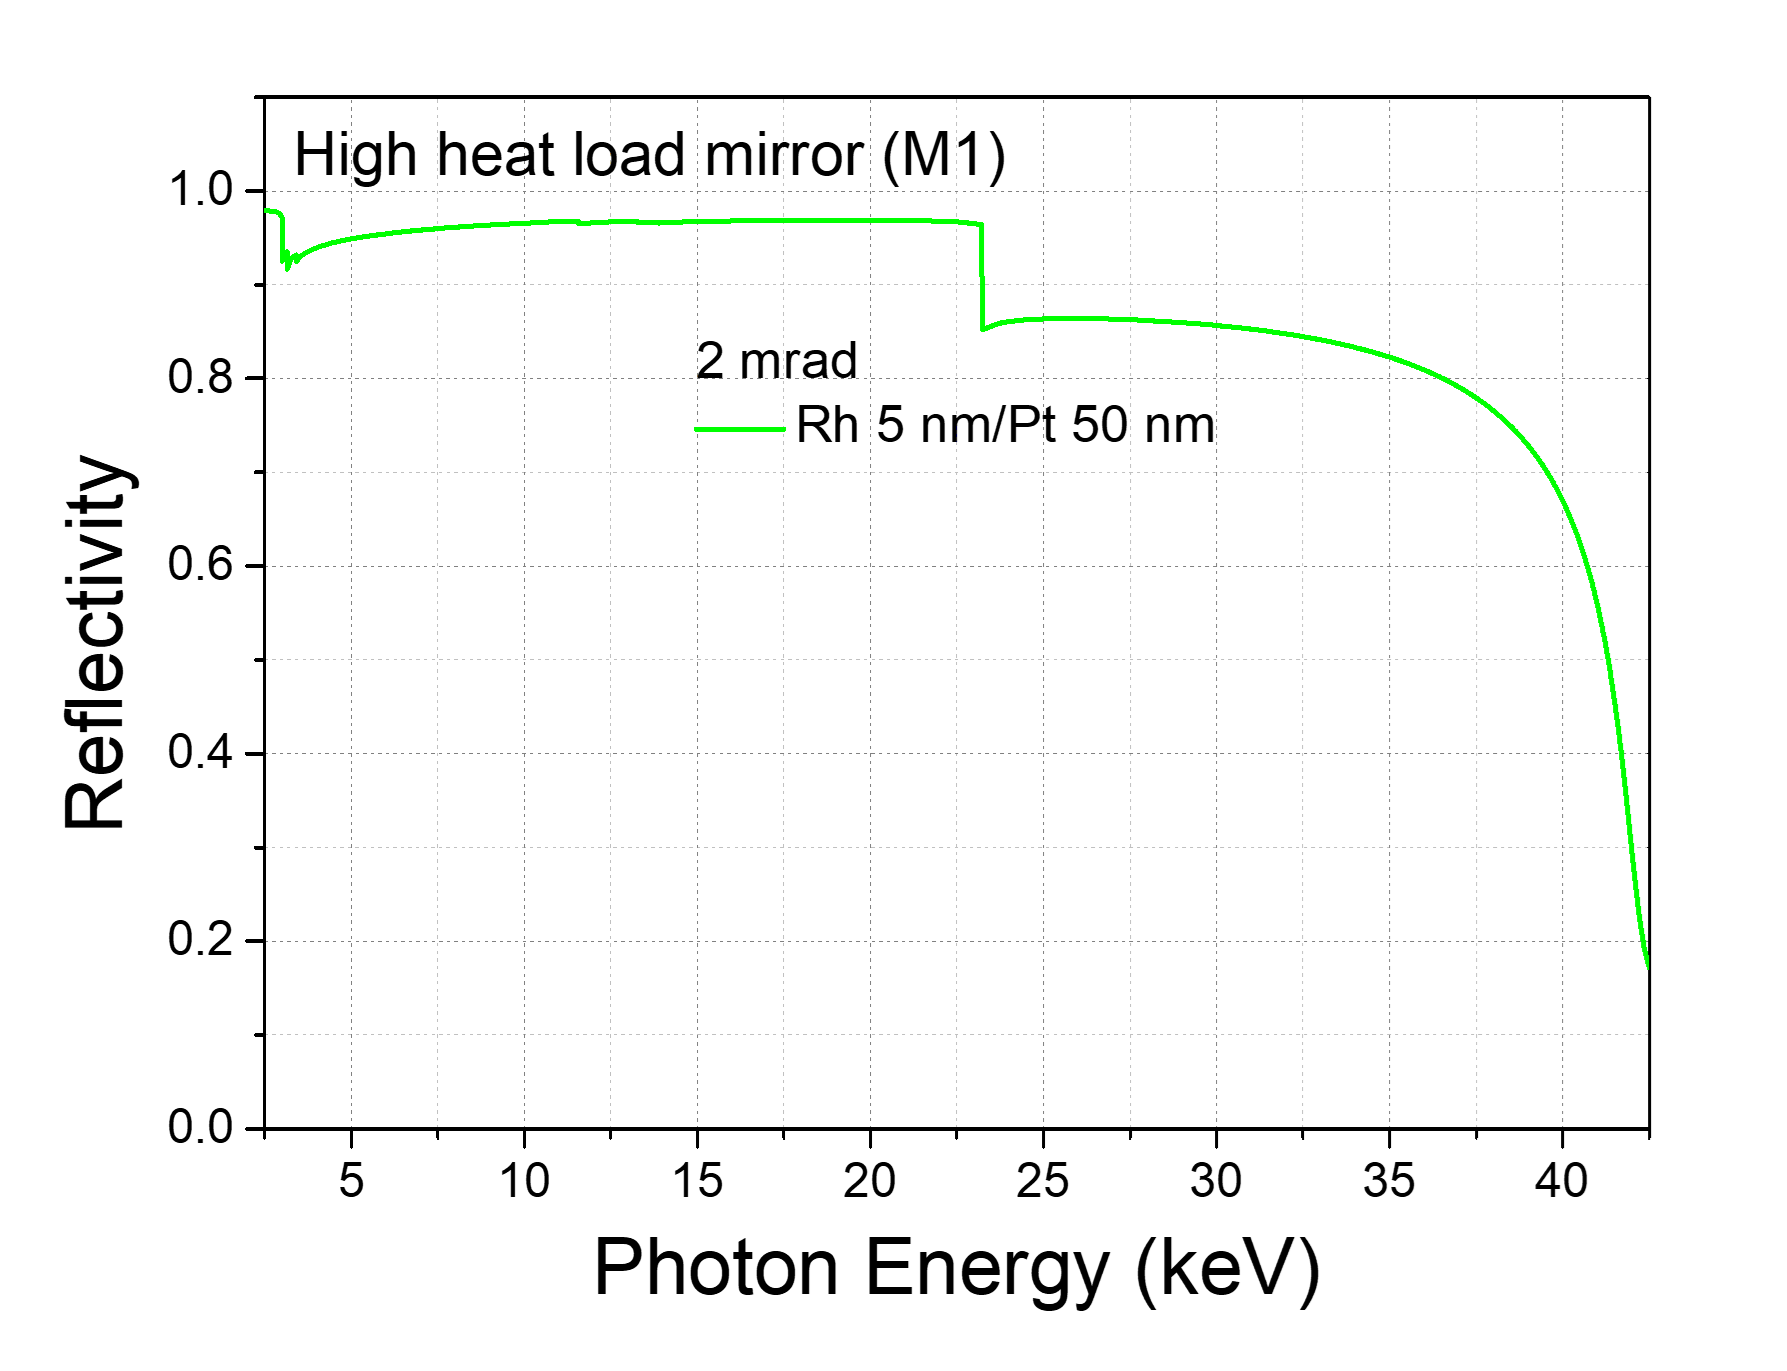
Figure 7. Reflectivity curve of the HHLM
HHLM will be the first optical component of the RXAFS beamline. To deliver photon beams with an energy range of 4-40 keV, Rh 5 nm/Pt 50 nm bilayer will be used as a coating material for the mirror surface. The incident angle of the beam will be set at 2 mrad and will be fixed during operation to satisfy the ease of the beam alignment process. Figure 7 shows the reflectivity curve of the HHLM corresponding to photon energy, with no noticeable reflectivity decrease across the entire energy range of 4-40 keV. The HHLM reflects the beam horizontally and is cylindrical in the sagittal direction of the mirror crystal. Accordingly, it can collimate a beam vertically, thereby enhancing the energy resolution of a monochromatic beam and reducing flux loss due to the limited Darwin width of the Si crystal in the monochromator.
6.3 Quick Double Crystal Monochromator (QDCM)
The QDCM, located at 48.5 m from the source, will serve the following purposes:
Quick-monochromatization
The crystal stage of QDCM will consist of two liquid nitrogen-cooled channel-cut crystals (Si (111) and Si (311)) placed next to each other, and the crystals can be switched depending on the photon energy to be used. The QDCM will have a maximum scanning speed of 60 Hz, enabling XAS measurements every ten milliseconds when XAS data are obtained in both forward and reverse scanning directions. The typical measurement time for XAS using standard DCM is a few seconds to a few minutes. It is important to note that QDCM is crucial for the RXAFS beamline because the main goal of the beamline is to provide real-time measurement methods during various in situ/operando experiments.
Table 5. Motor specifications
Scan mode |
Movement |
Ran ge* |
Motor Speed (frequency) |
|---|---|---|---|
Bragg angle Step mode (θS) |
Goniometer step motor |
4° ~ 25° |
1° s-1 (~ 0.2 keV s-1 @ 5 keV) (~ 1 keV s-1 @ 10 keV) |
Bragg angle Fast scan mode (θF) |
Torque motor on the the goniometer |
± 2.1° |
0.1 ~ 60 Hz |
QDCM will be operated at various Bragg rotation speeds using two types of motors: a Goniometer step motor and a torque motor on the goniometer. Table 5 provides a summary of each motor’s specifications. The choice of motor type depends on the chemical reaction rate of the reaction system being studied. The photon energy from the source can be adjusted by tuning the magnetic gap of the undulator. However, changing the photon energy of a beam from the undulator at a speed required by QDCM is challenging. Therefore, it is crucial to perform undulator tapering, which widens the energy bandwidth of the photon beam, when using QDCM.
6.3 Double Crystal Monochromator (DCM)
The DCM, located at 50 m from the source, will serve the following purposes:
Monochromatization
The crystal stage of DCM will consist of two liquid nitrogen-cooled Si crystals (Si (111) and Si (311)) placed next to each other. The crystals can be interchanged based on the photon energy needed. The DCM will be utilized for standard XAS, with a measurement time ranging from a few seconds to several minutes. Additionally, XES measurements, which require a stable beam during the procedure, will be performed using this DCM. The angular stability over an extended period (hours to days) should be maintained within a variation of about 20-50 nrad to ensure beam stability.
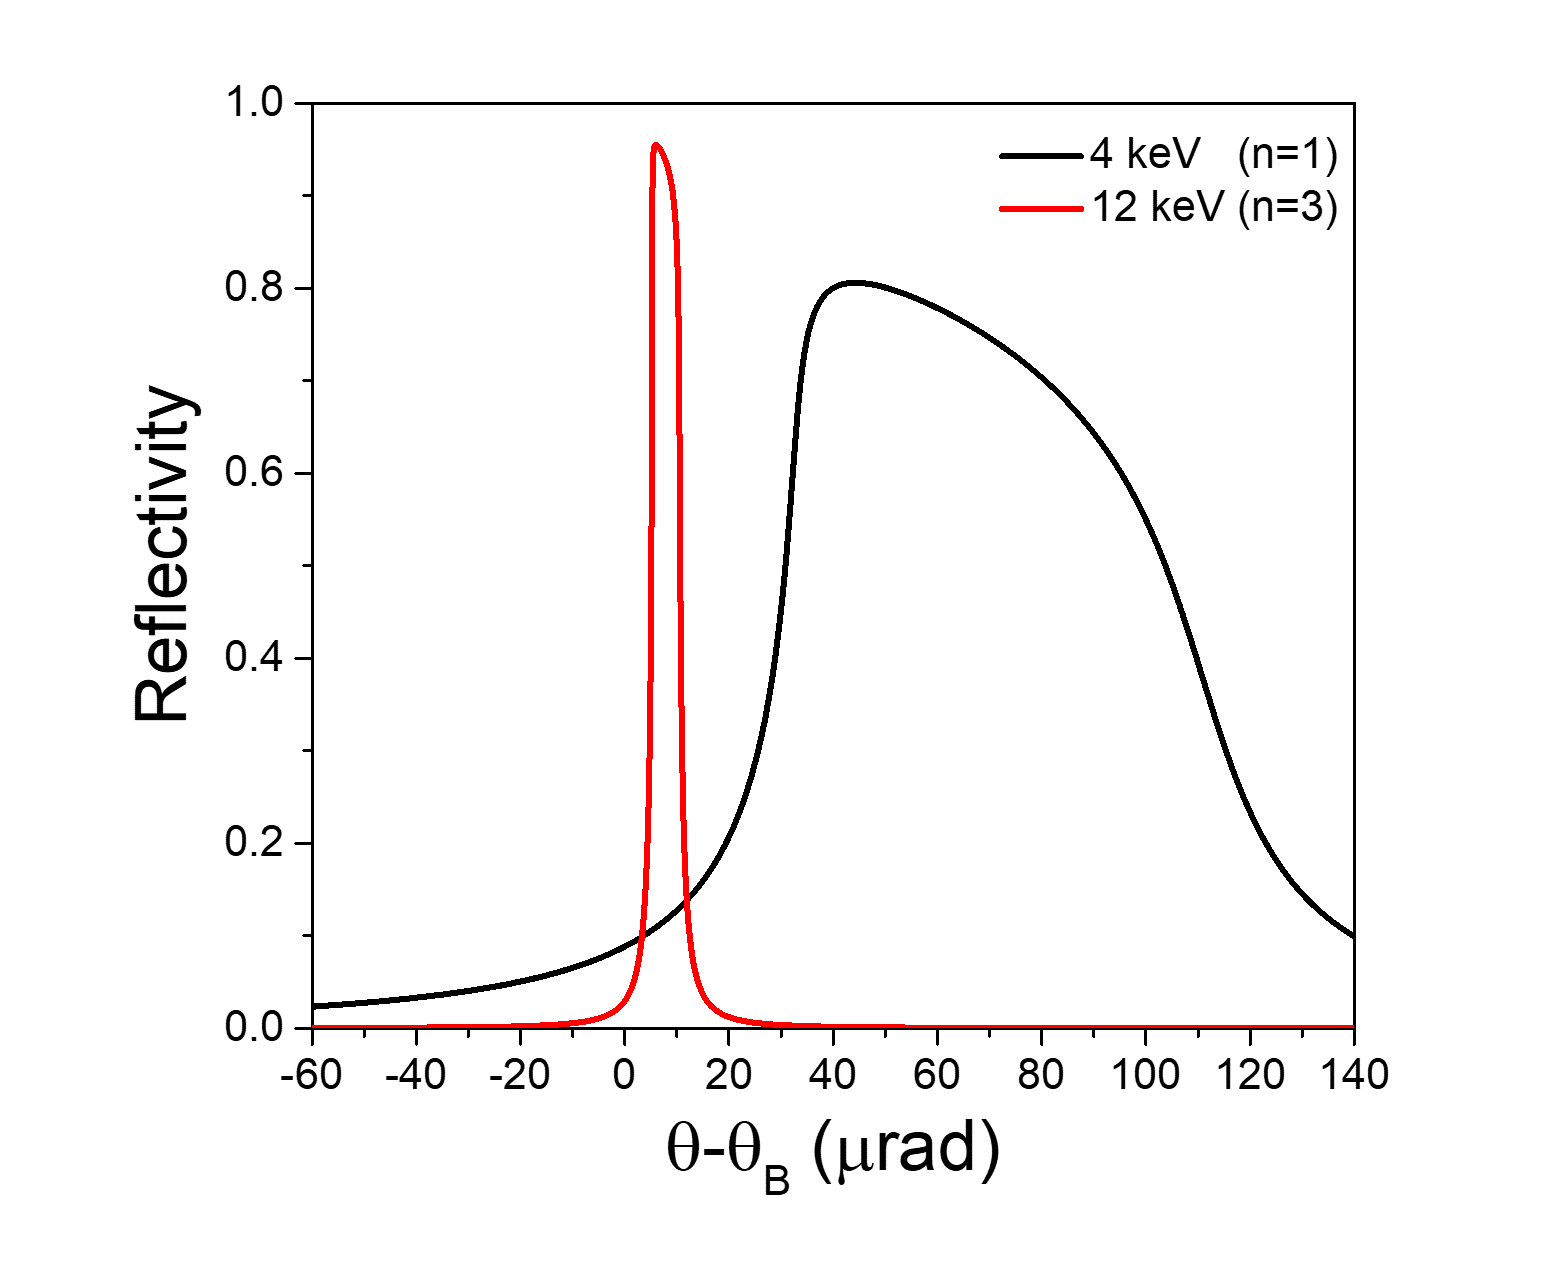
Figure 8. Darwin width curve of Si (111)
After passing through the double crystal monochromator (DCM), the monochromatic beam may contain high-order harmonics that share the same diffraction condition with the desired beam energy. This issue can be overcome by slightly detuning the 2nd crystal of the DCM to reject the high-order harmonics. In Figure 8, the Darwin width curves of the Si (111) crystal are depicted regarding two different harmonic energies. By detuning the 2nd crystal by approximately 70 µrad relative to the Bragg axis, it is possible to effectively suppress the high-order harmonic due to differences in reflectivity of each harmonic energy.
The energy resolution of the monochromatic beam passed through the DCM can be determined using the following equation: \(\frac{\mathrm{\Delta}E}{E} = cot\theta_{B}\left\lbrack \omega_{D}^{2} + \varphi^{2} \right\rbrack^{\frac{1}{2}}\ \)
In this equation, θB, ωD, and φ represent the Bragg angle, the Darwin width of the Si crystals, and the photon beam divergence, respectively. Table 6 provides an overview of the calculated energy resolution of the RXAFS beamline, considering the effects of both collimated and uncollimated beams. For Si (111), the energy resolution with a collimated beam is smaller than the natural bandwidth for a specific element, indicating the possibility of obtaining undistorted XAS data. Conversely, if the beam is not collimated, the energy resolution may exceed the natural bandwidth, potentially distorting the XAS data.
For a beam obtained from a Si (311) crystal, the energy resolution is smaller than the natural bandwidth for a specific element. However, it is important to note that the Darwin width of the Si (311) crystal in the energy range of 15 keV to 40 keV is within the range of 7.9 - 2.8 μrad (FWHM). The vertical divergence of the photon beam from the source in the same energy range is approximately 26 μrad (FWHM). Significant flux losses may occur in these cases due to the small Darwin width of the Si (311) crystal compared with the photon beam divergence. Therefore, a collimated beam is required to mitigate flux losses by effectively reducing photon beam divergence in this case.
Table 6. The calculated energy resolution of a monochromatic beam
Si (11 1) |
Edge Energy (keV)* |
** ΔE/E** (w.o. co llimat ion)* |
Δ E/E ** (with coll imati on)** |
** Natural Band width** (FWHM, eV)* |
||
|---|---|---|---|---|---|---|
En ergy (ke V) |
ΔE/E ( 10-4) (w.o. colli mation) |
ΔE/E ( 10-4) (with colli mation) |
||||
5 |
1.56 |
1.4 |
Ti K (4.966) |
0.77 |
0.70 |
0.94 |
10 |
1.94 |
Zn K (9.659) |
1.87 |
1.35 |
1.67 |
|
15 |
2.46 |
Rb K (15.200) |
3.74 |
2.13 |
2.99 |
|
20 |
3.04 |
Mo K (20.000) |
6.08 |
2.80 |
4.52 |
|
25 |
3.50 |
Pd K (24.350) |
8.52 |
3.41 |
6.24 |
|
Si (31 1) |
Edge energy (keV)* |
** ΔE/E** (w.o. co llimat ion)* |
Δ E/E ** (with coll imati on)** |
** Natural Band Width** (FWHM, eV)* |
||
En ergy (ke V) |
ΔE/E ( 10-4) (w.o. colli mation) |
ΔE/E ( 10-4) (with colli mation) |
||||
15 |
1.06 |
0.3 |
Rb K (15.200) |
1.61 |
0.46 |
2.99 |
20 |
1.41 |
Mo K (20.000) |
2.82 |
0.60 |
4.52 |
|
25 |
1.68 |
Pd K (24.350) |
4.09 |
0.73 |
6.24 |
|
30 |
2.04 |
Sb K (30.491) |
6.22 |
0.91 |
9.16 |
|
35 |
2.40 |
Cs K (35.985) |
8.64 |
1.08 |
12.3 |
|
40 |
2.76 |
Ce K (40.443) |
11.2 |
1.21 |
15.1 |
The scanning speed of the Bragg angle for this DCM should be adjustable from 0.001°/sec to 4°/sec without requiring any hardware or software modifications. This flexibility enables us to swiftly switch between measurement modes. Additionally, the beam offset should match that of the QDCM, facilitating easy optical alignment when switching between the two monochromators. Several manufacturers meet these specified criteria.
6.4 Horizontal Focusing Mirror (HFM)
The HFM, located at 53.5 m from the source, will serve the following purposes:
Beam focusing in a horizontal direction
High harmonic rejection
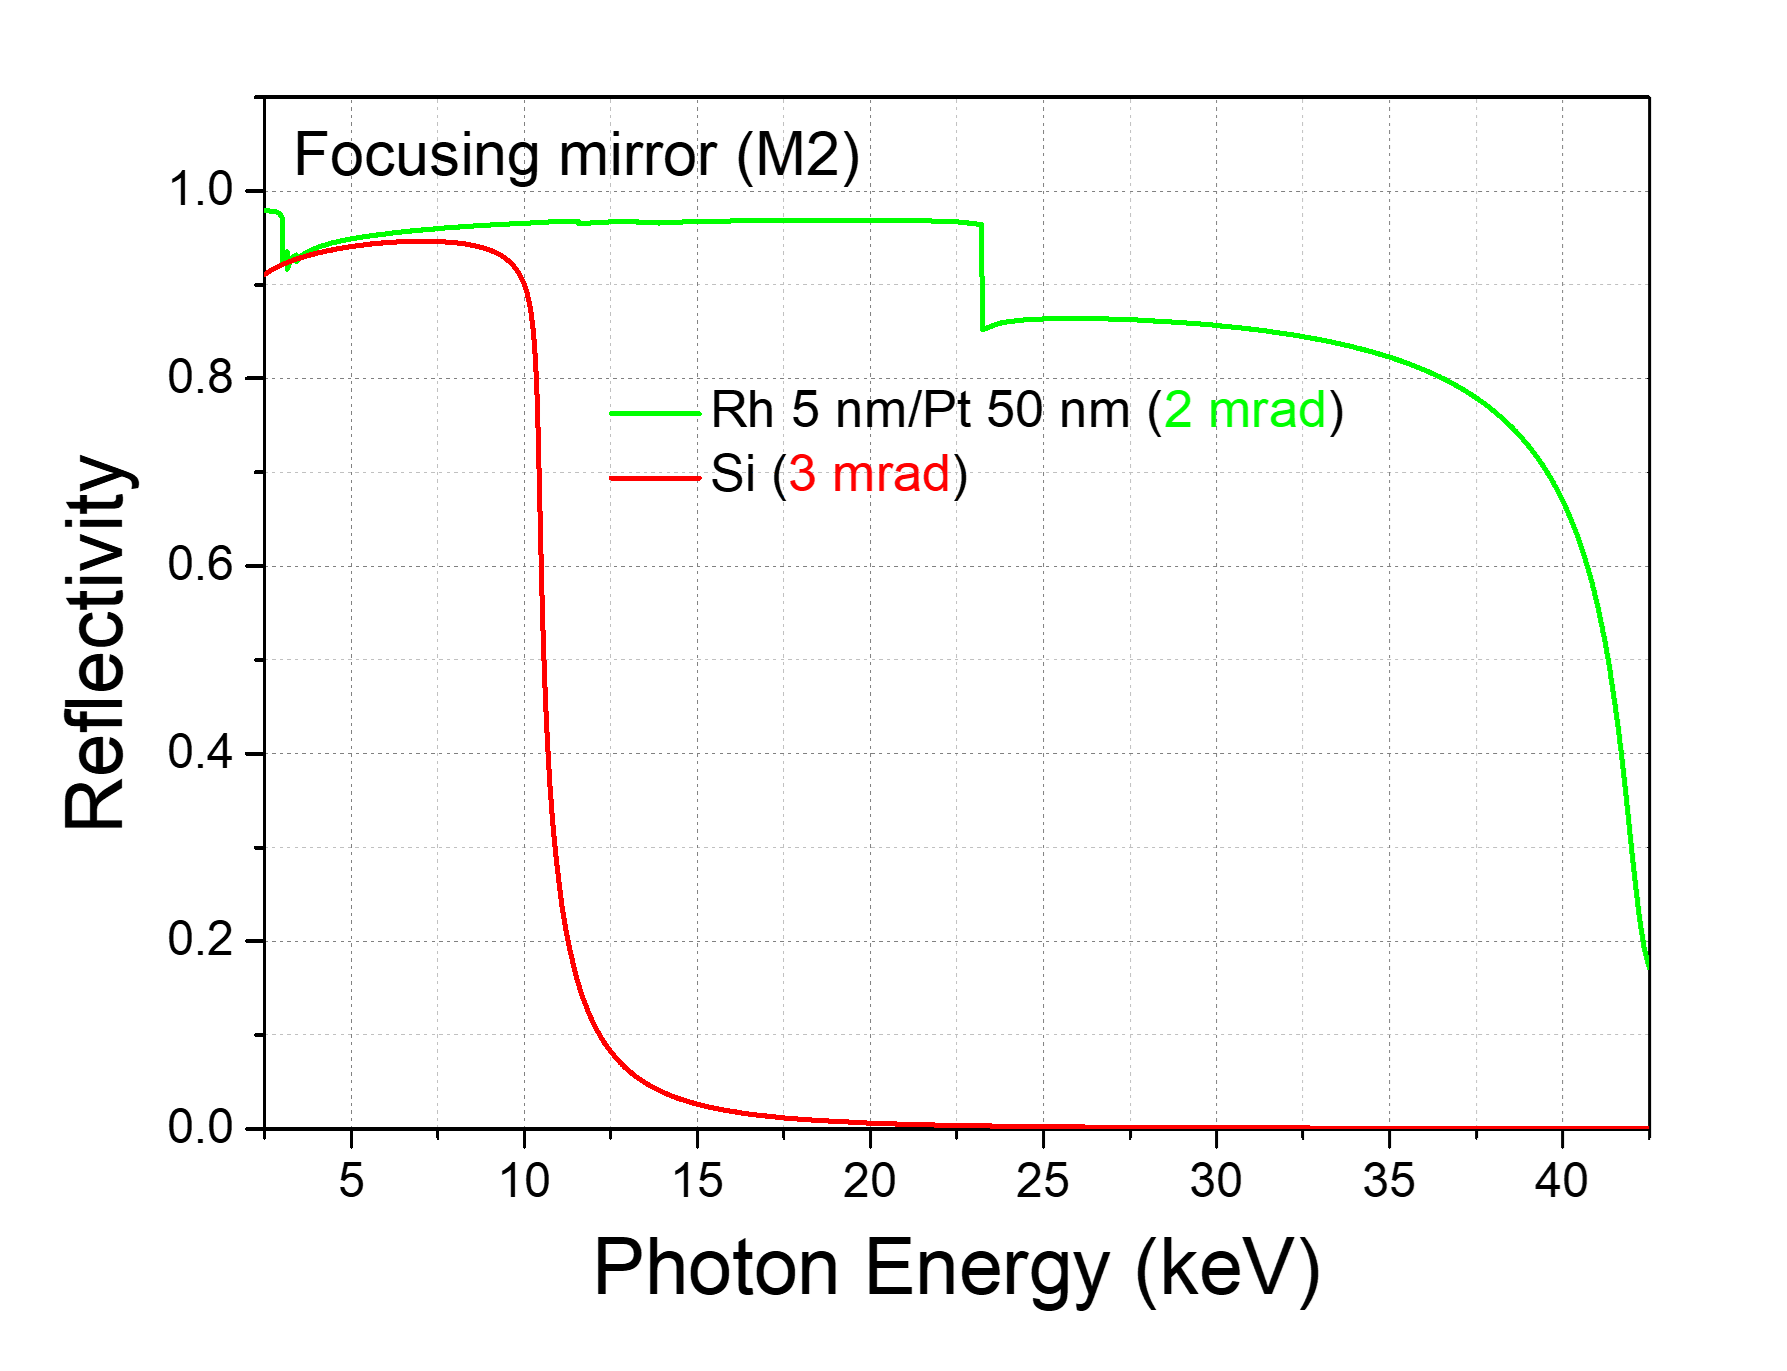
Figure 9. Reflectivity curve of the HFM
The Horizontal Focusing Mirror (HFM) is designed to reflect the beam vertically (up-bounce) and has a sagittal cylindrical shape, allowing it to focus the beam horizontally. It consists of two mirror surfaces with different coatings and sagittal radii, enabling it to focus the beam and reject high harmonics by adjusting the incident angle. Figure 9 illustrates the reflectivity curve of the HFM with two mirror surfaces: a Rh 5 nm/Pt 50 nm bilayer and Si, for incident angles of 2 mrad and 3 mrad, respectively. The RXAFS beamline will deliver a photon beam with energies starting from 4 keV. Therefore, it is essential to remove high harmonics when using the beam around this energy. When users need to adjust the photon energy across a wide range of 4-40 keV in a single beamtime, they will use a mirror with a Rh 5 nm/Pt 50 nm coating in a fixed mode. Harmonic rejection will then be achieved by detuning the 2nd crystal of the DCM for beamline management. By allowing users to easily switch between different photon energies, the HFM provides a flexible and efficient solution for a wide range of experimental requirements.
6.4 Harmonic Rejection Mirror (HRM)
The HRM, located at 54.35 m from the source, will serve the following purposes:
Beam focusing in a vertical direction
High harmonic rejection
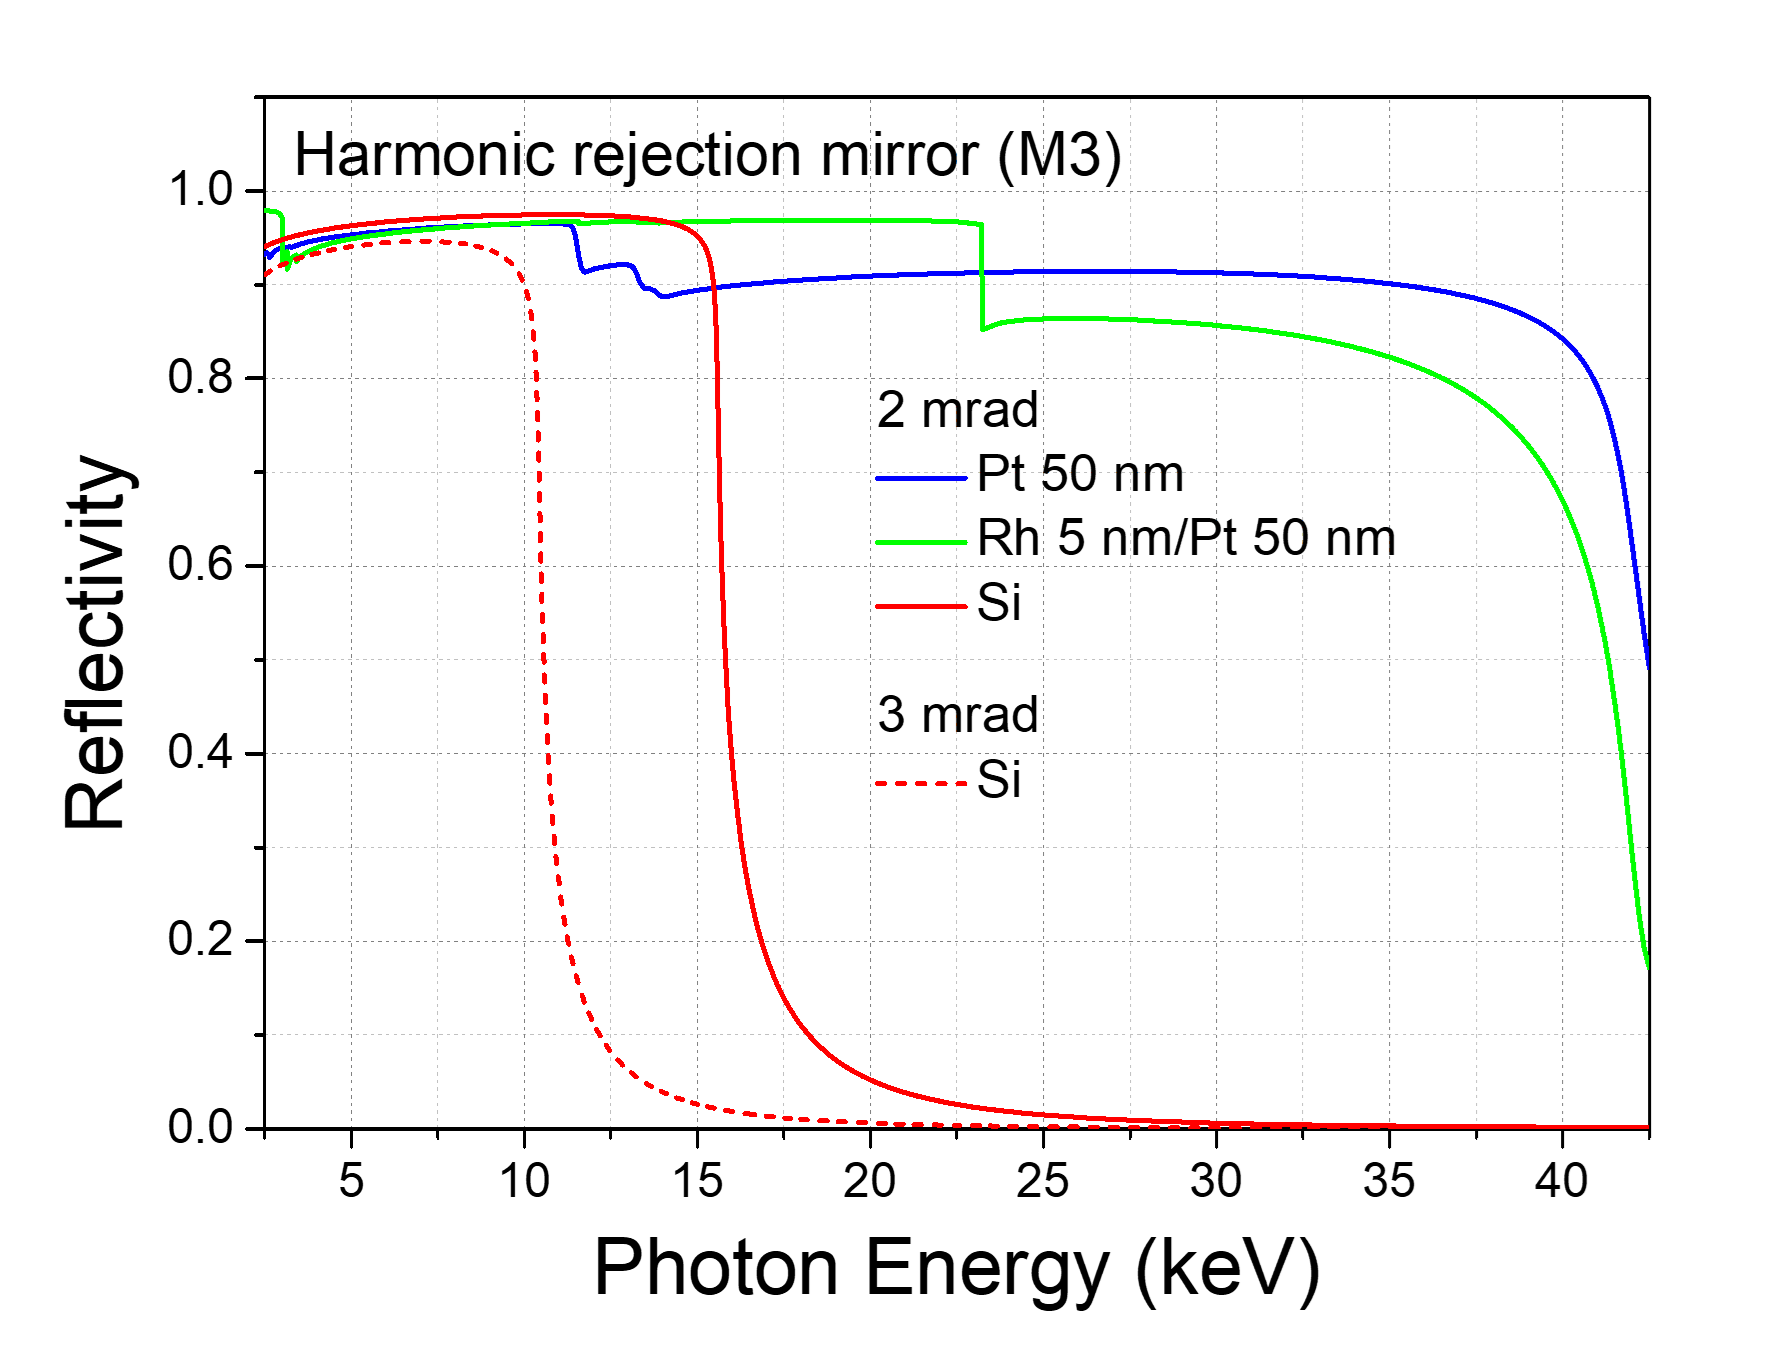
Figure 10. Reflectivity curve of HRM
The Horizontal Focusing Mirror (HRM) is designed to reflect the beam vertically (down-bounce) and has an originally flat shape, allowing it to focus the beam vertically using the bender. It consists of three mirror surfaces: Si, Rh 5 nm/Pt 50 nm, and Pt 50 nm. The mirror surface can be adjustable depending on the beam energy being used. When the beam energy is lower than 15 keV, the Si surface will be used to remove the high harmonics effectively. Adjusting the incident angle from 2 mrad to 3 mrad is an additional option to remove the high harmonics when using the beam with energy around 4 to 5 keV. It is difficult to remove the high harmonics by detuning the crystal in the QDCM, which uses the channel-cut Si; the effective rejection of high harmonics is more important through this HRM during the QXAS measurement. For normal XAS, the Rh 5 nm/Pt 50 nm will be used normally and the high harmonics also can be removed by detuning of the 2nd crystal of DCM.
to remove the high harmonics
The Horizontal Focusing Mirror (HFM) is designed to reflect the beam vertically (up-bounce) and has a sagittal cylindrical shape, allowing it to focus the beam horizontally. It consists of two mirror surfaces with different coatings and sagittal radii, enabling it to focus the beam and reject high harmonics by adjusting the incident angle. Figure 9 illustrates the reflectivity curve of the HFM with two mirror surfaces: a Rh 5 nm/Pt 50 nm bilayer and Si, for incident angles of 2 mrad and 3 mrad, respectively. The RXAFS beamline will deliver a photon beam with energies starting from 4 keV. Therefore, it is essential to remove high harmonics when using the beam around this energy. When users need to adjust the photon energy across a wide range of 4-40 keV in a single beamtime, they will use a mirror with a Rh 5 nm/Pt 50 nm coating in a fixed mode. Harmonic rejection will then be achieved by detuning the 2nd crystal of the DCM for beamline management. By allowing users to easily switch between different photon energies, the HFM provides a flexible and efficient solution for a wide range of experimental requirements.